All decks 06 / 07
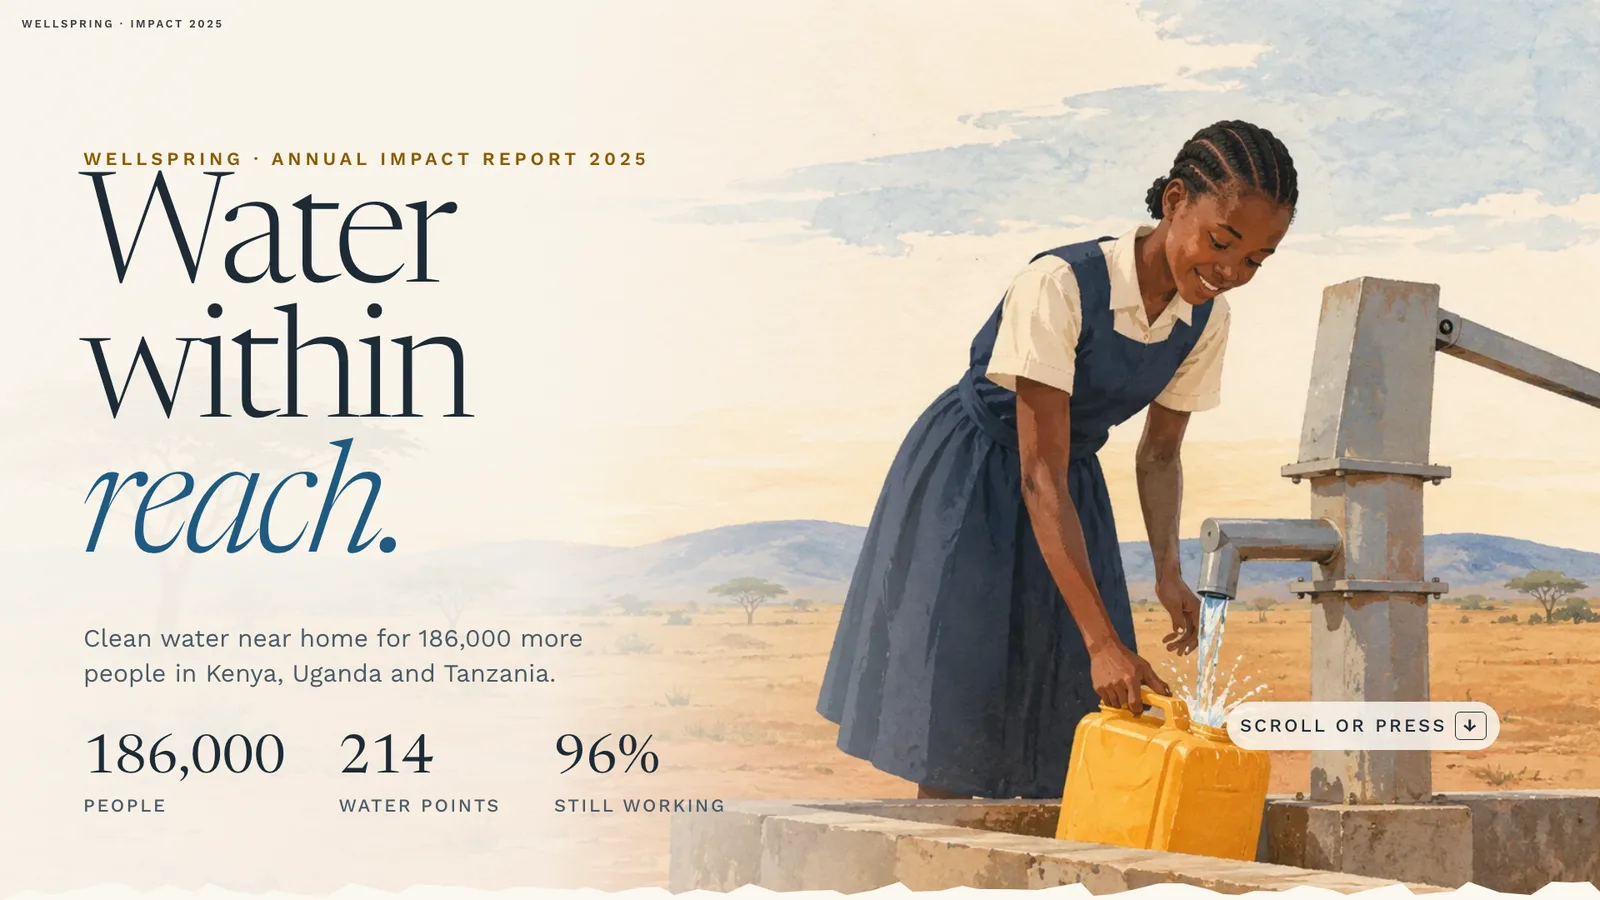
Wellspring slide 1: Water within reach
01Water within reachType
Concept

Wellspring

Water within reach. A live annual impact report.

TypeLive web deckSectorCharity · clean waterStyleWarm editorial, data-ledColour

Open the live deck

The challenge

A clean-water charity reports its year to donors, trusts and companies. Readers need to see what changed for real people, and where every pound went.

The solution

A live web deck in 16 sections. A map, a people grid and charts build as you step through. Each section carries one number. The report ends on the 2026 plan and a thank-you.

Project information

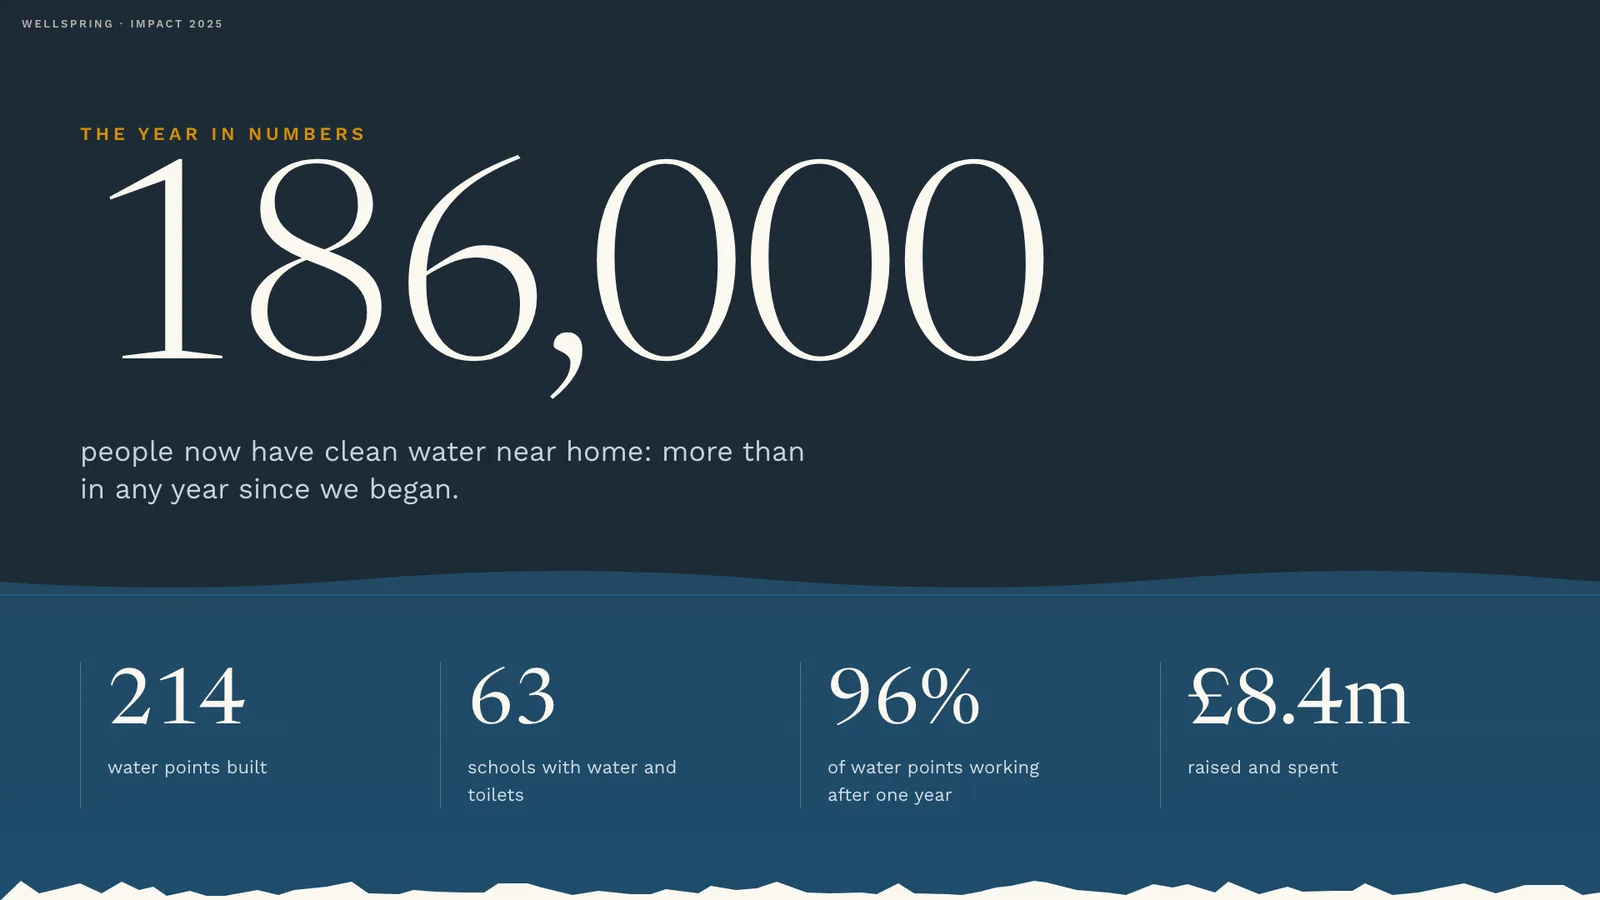
Wellspring is a fictional charity, and every figure in the deck is illustrative. It reports one year of work in Kenya, Uganda and Tanzania: clean water near home for 186,000 more people, from 214 water points.

The deck runs in the browser and moves one step at a time with the keyboard, the mouse or a tap. Headlines are set in Newsreader and body text in Work Sans, on a paper ground with ochre and water blue. It is also delivered as a 64-second video and a PowerPoint and PDF backup.

Charity
Wellspring (fictional)
Audience
Donors, trusts and companies
Deck
Annual impact report 2025
Sections
16 · live web deck
Reach
186,000 people · 214 water points
Delivered
Live web deck, 64 s video, PowerPoint + PDF

The deck system

Colour
Type
Aa

Water within reach. A live annual impact report.

NewsreaderHeadlines · 400
Aa

Water within reach. A live annual impact report.

Work SansBody text · 400
Built in
16live sections
214water points
96%still working after one year
100Lighthouse accessibility

Slide by slide 16 slides · 16 shown here

01The year

A letter from the director. Then the year in numbers and a live map of the four regions.
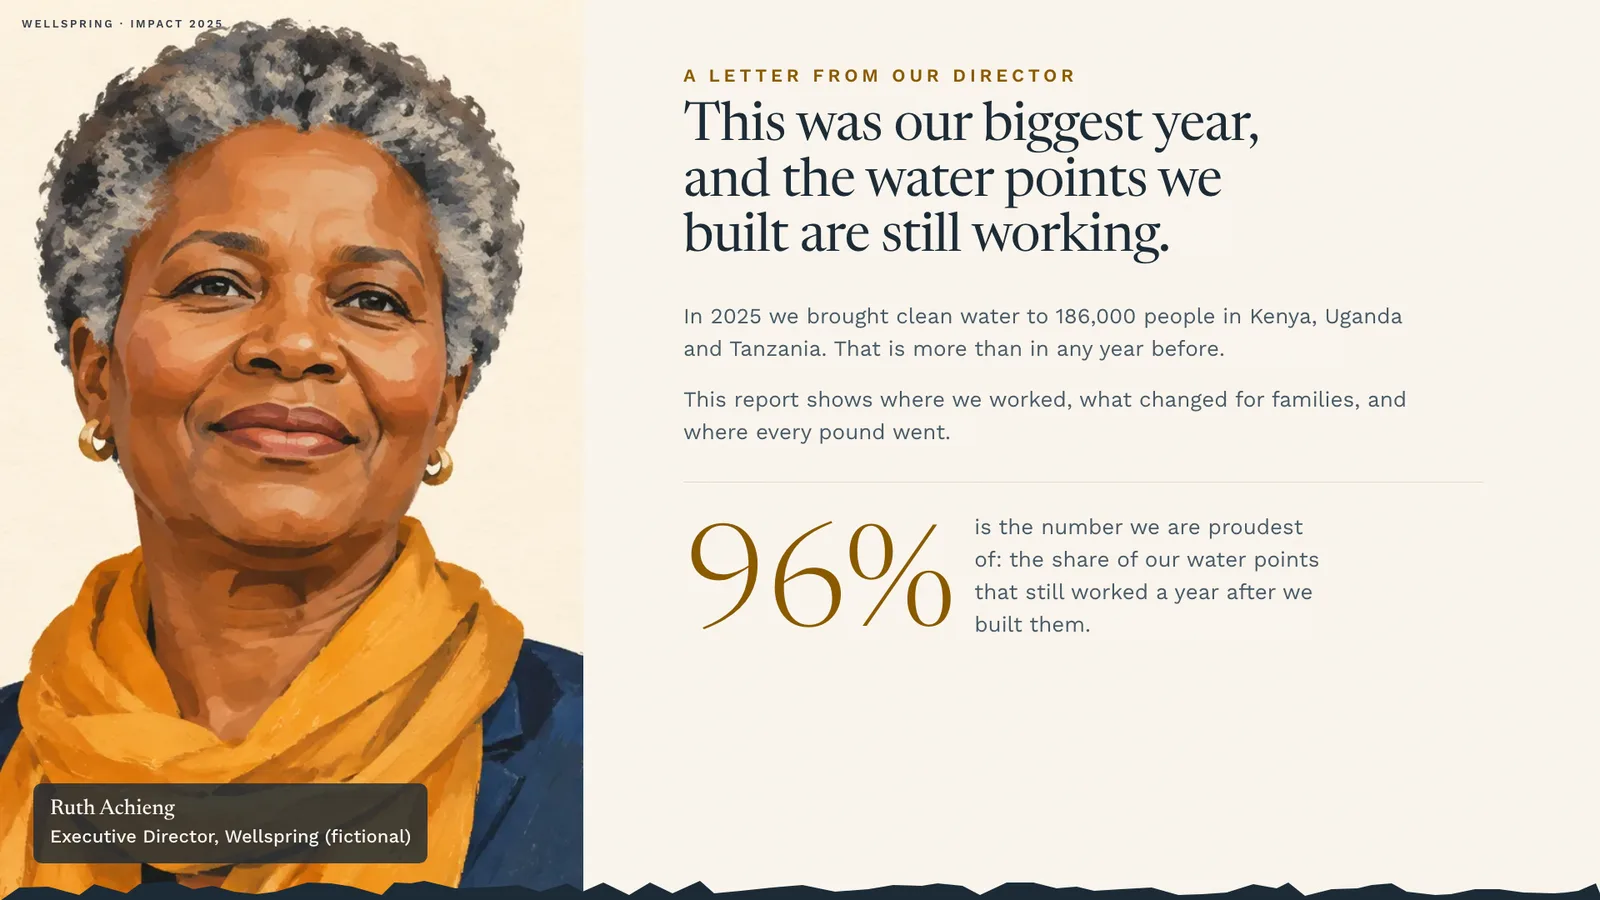
Wellspring slide 2: Director’s letter
02Director’s letterSystems
Wellspring slide 3: The year in numbers · 186,000 people, 214 water points
03The year in numbers · 186,000 people, 214 water pointsData
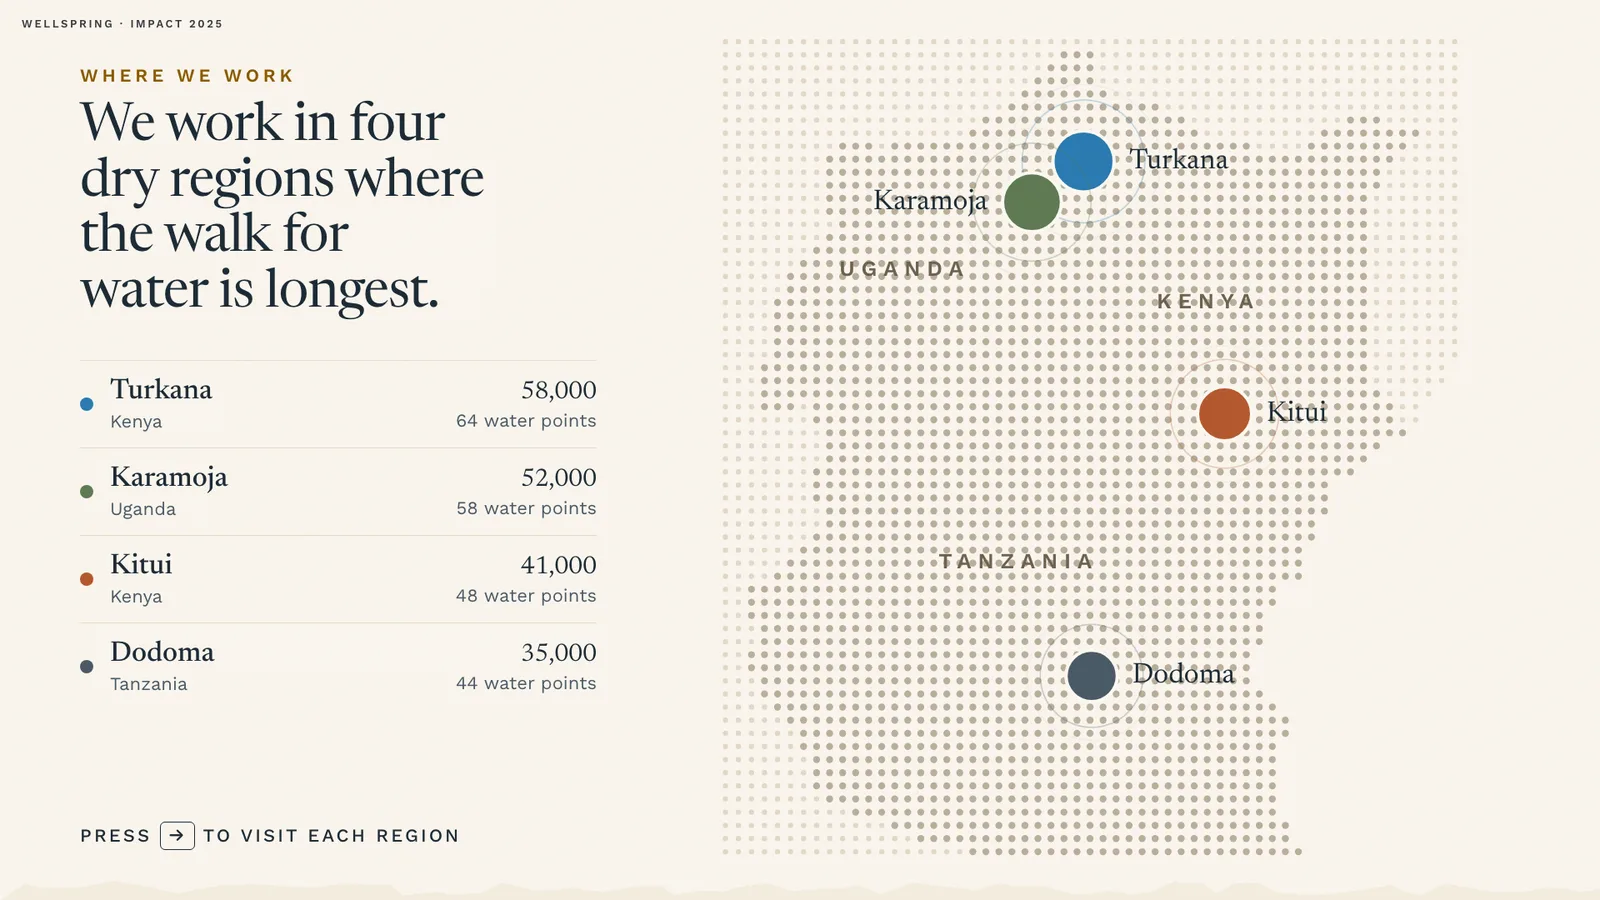
Wellspring slide 4: Where we work · four regions
04Where we work · four regionsData

02People, not totals

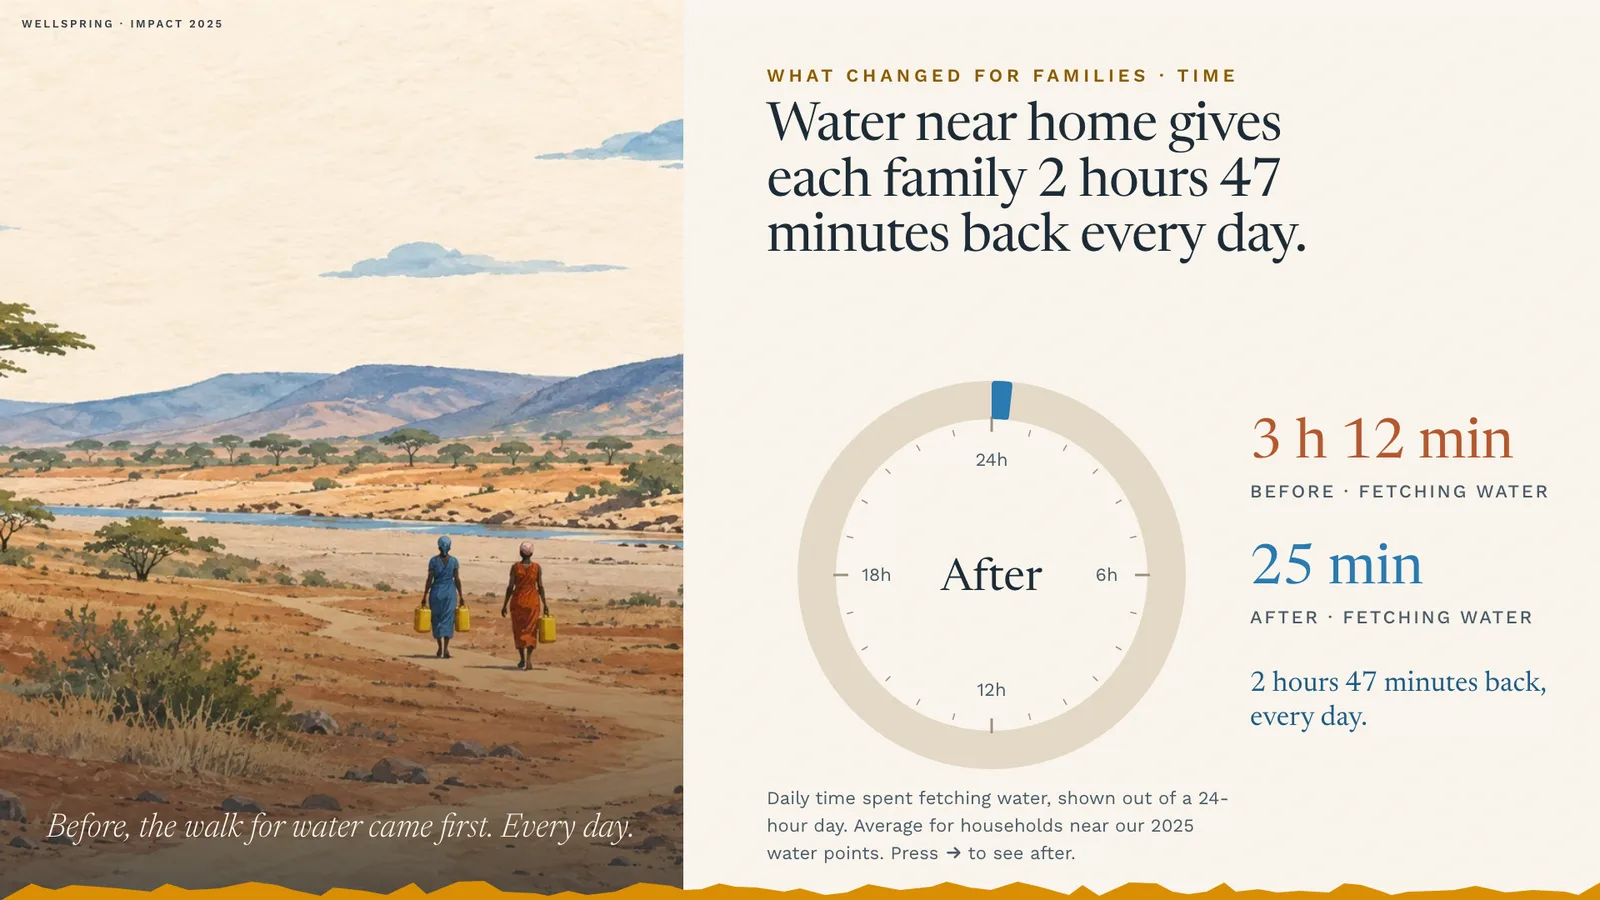
Every person drawn on the page. Then 2 h 47 min given back each day, and the myth most donors believe.
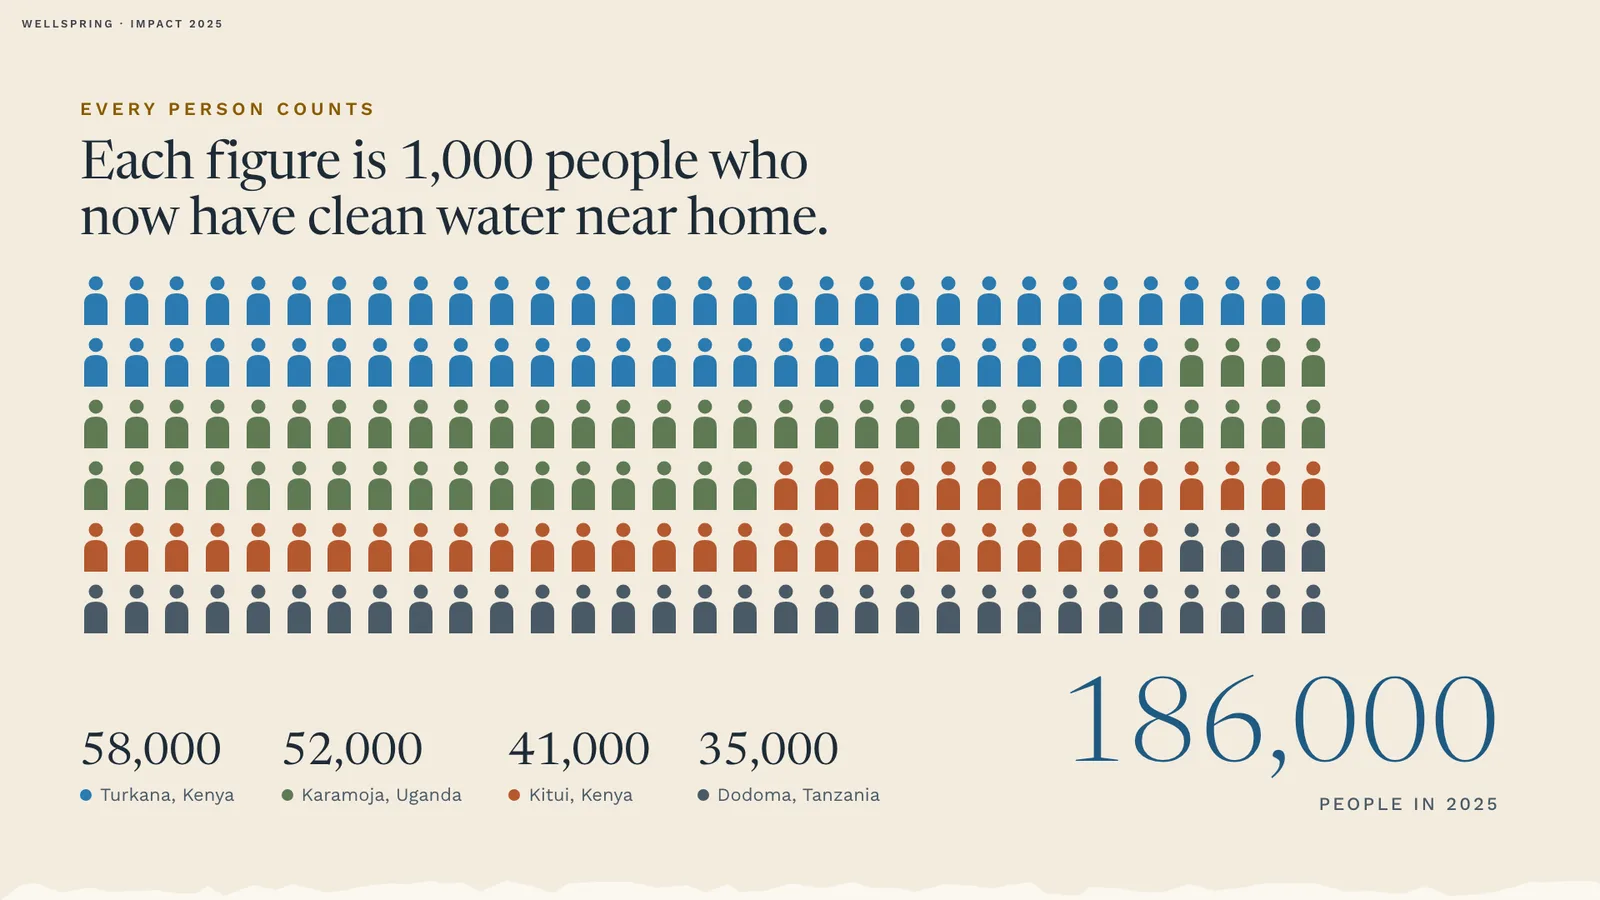
Wellspring slide 5: Every person counts
05Every person countsData
Wellspring slide 6: Time given back · 2 h 47 min a day
06Time given back · 2 h 47 min a dayData
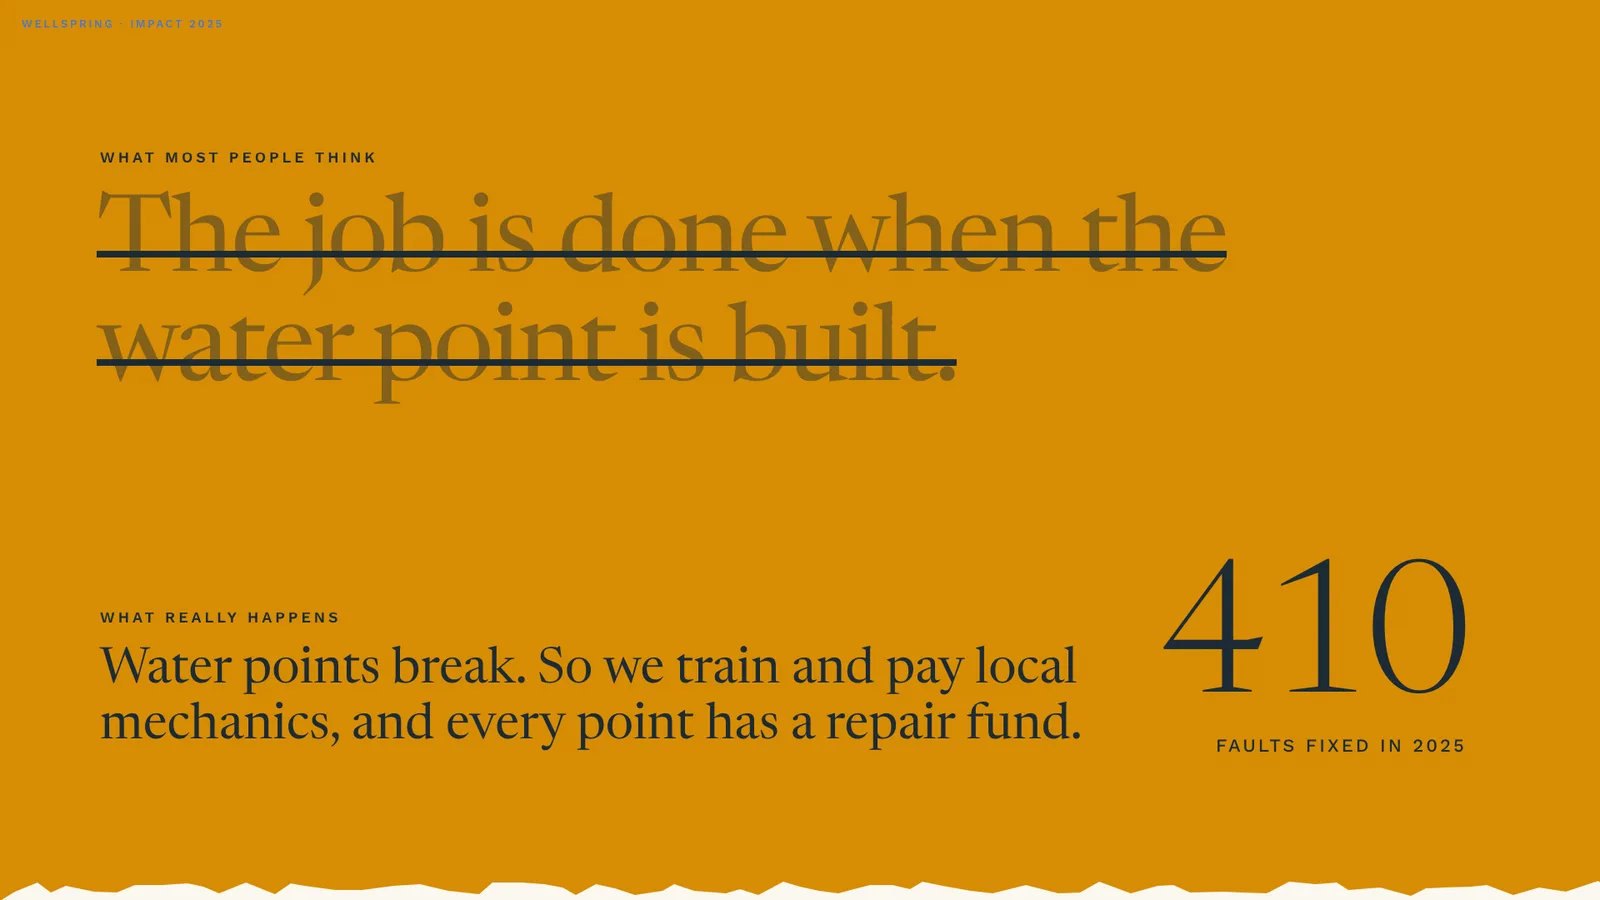
Wellspring slide 7: What most people think · 410 faults fixed in 2025
07What most people think · 410 faults fixed in 2025Structure

03One school, one girl

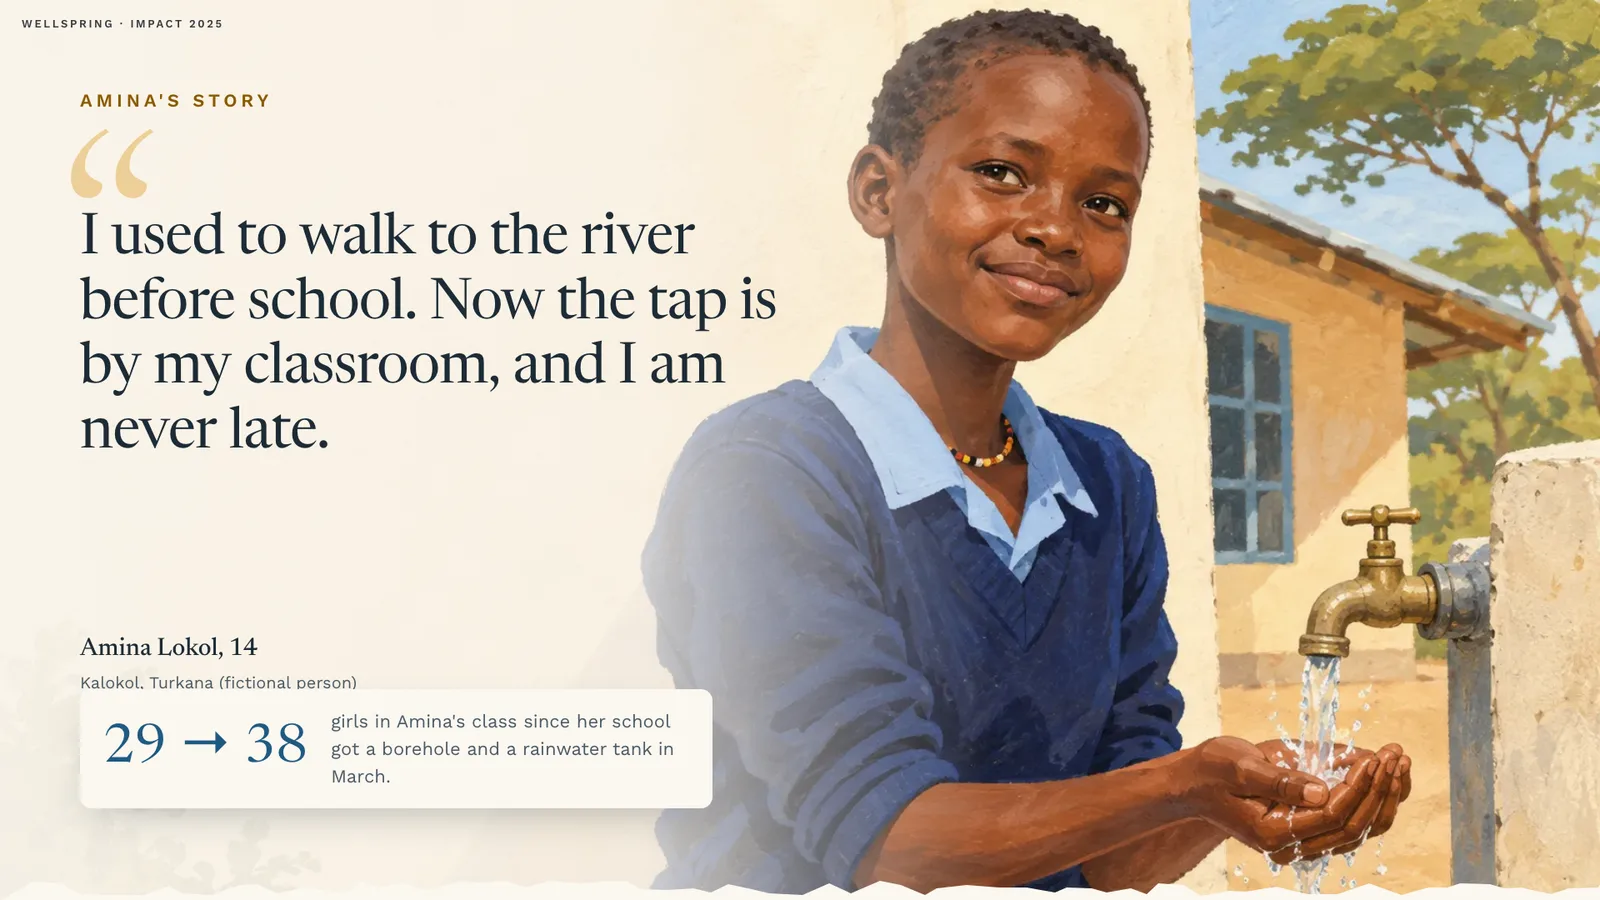
88% girls’ attendance and 41% fewer diarrhoea cases. Then one story: 29 girls in Amina’s class became 38.
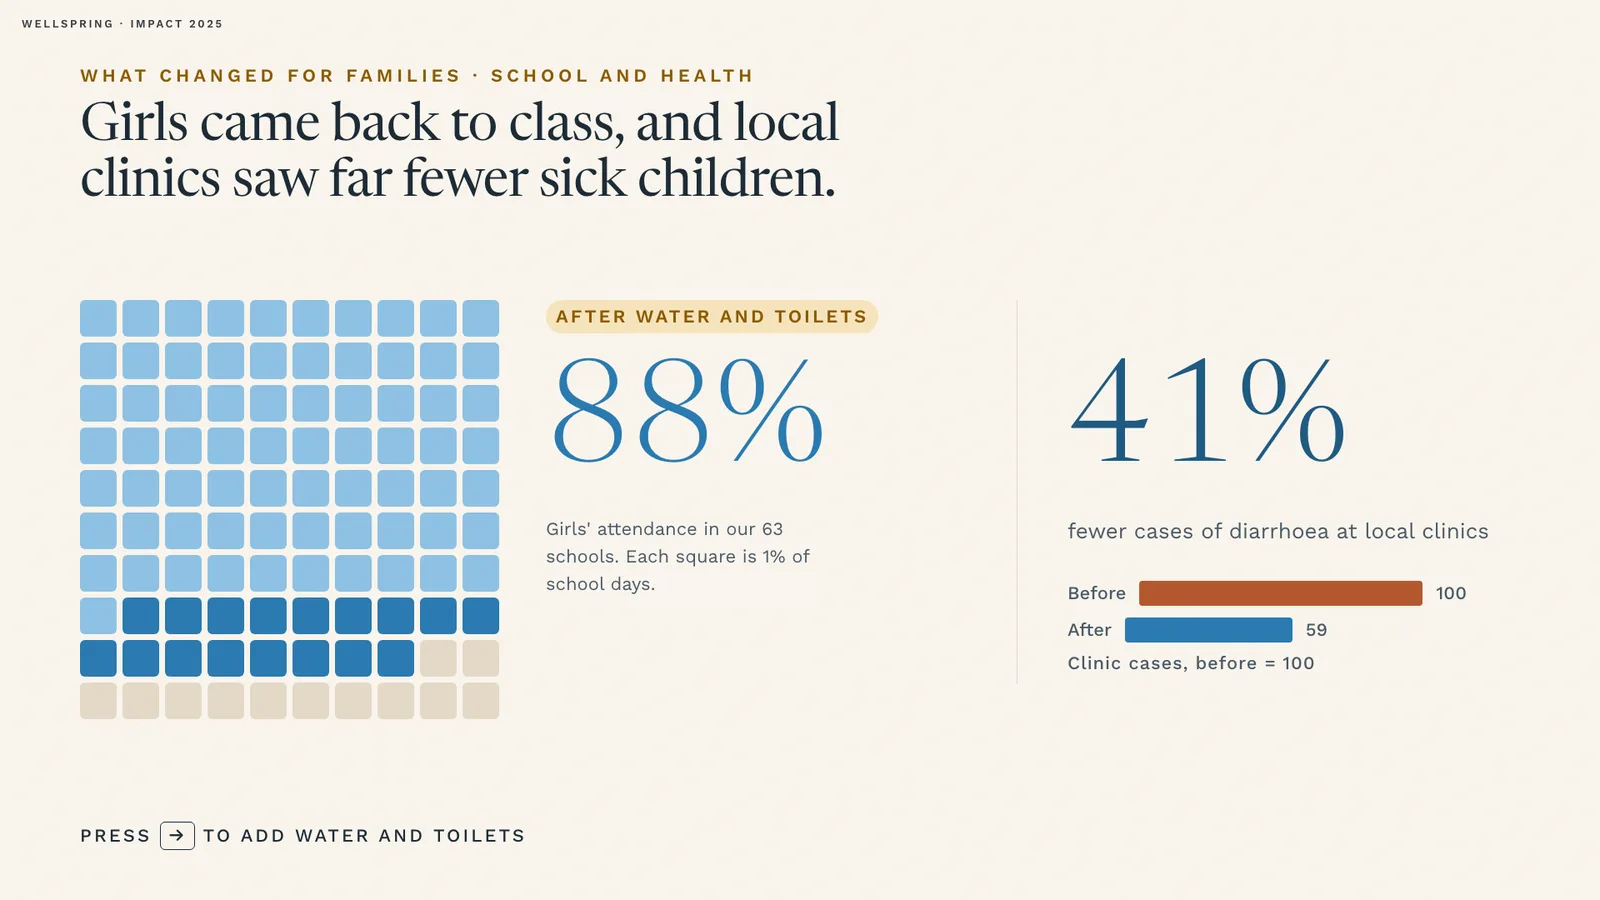
Wellspring slide 8: School and health · 88% girls’ attendance
08School and health · 88% girls’ attendanceData
Wellspring slide 9: Amina’s story · 29 → 38 girls in her class
09Amina’s story · 29 → 38 girls in her classSystems

04Built to last

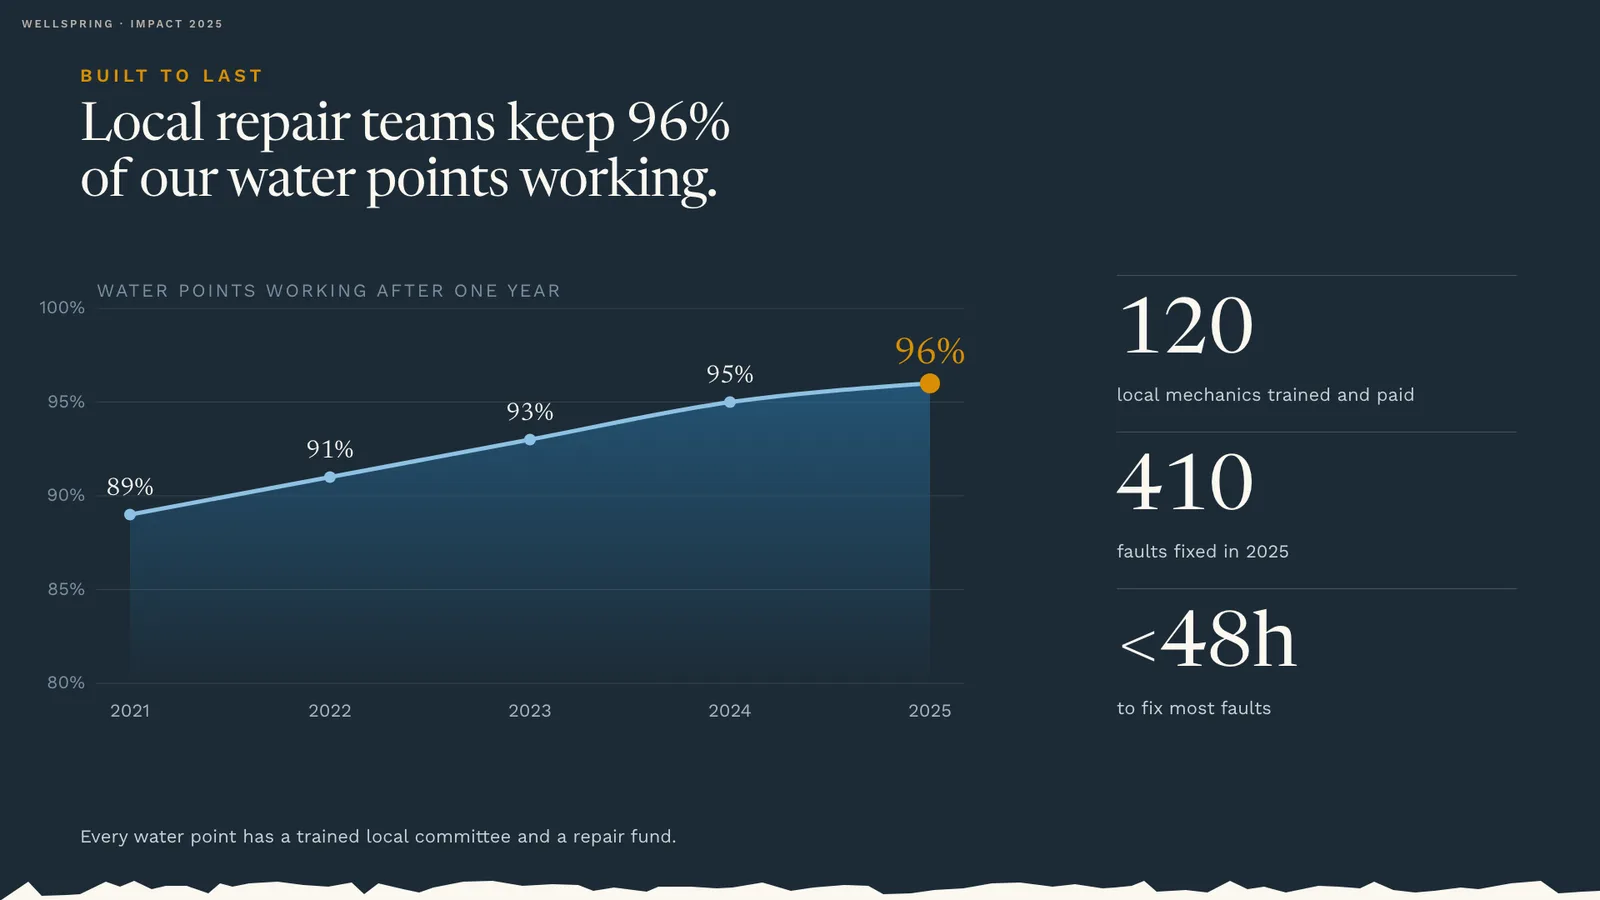
92 boreholes, 74 rainwater tanks and 48 protected springs. 96% still work after one year, with 120 local mechanics and fixes in under 48 hours.
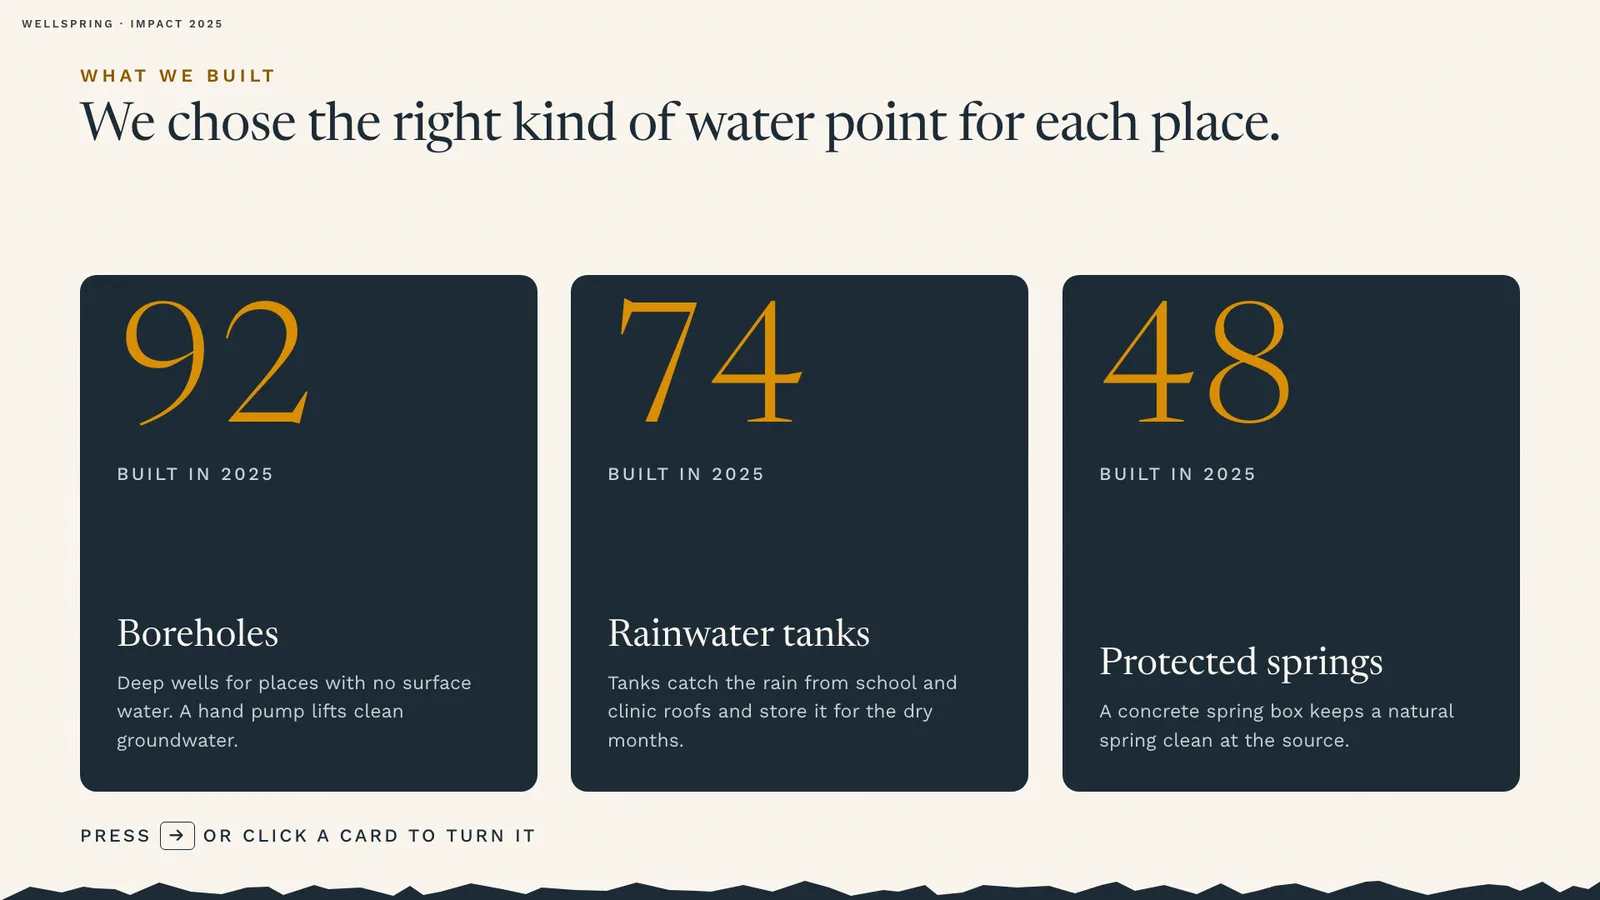
Wellspring slide 10: What we built · boreholes, tanks and springs
10What we built · boreholes, tanks and springsStory
Wellspring slide 11: Built to last · 96% still working
11Built to last · 96% still workingData
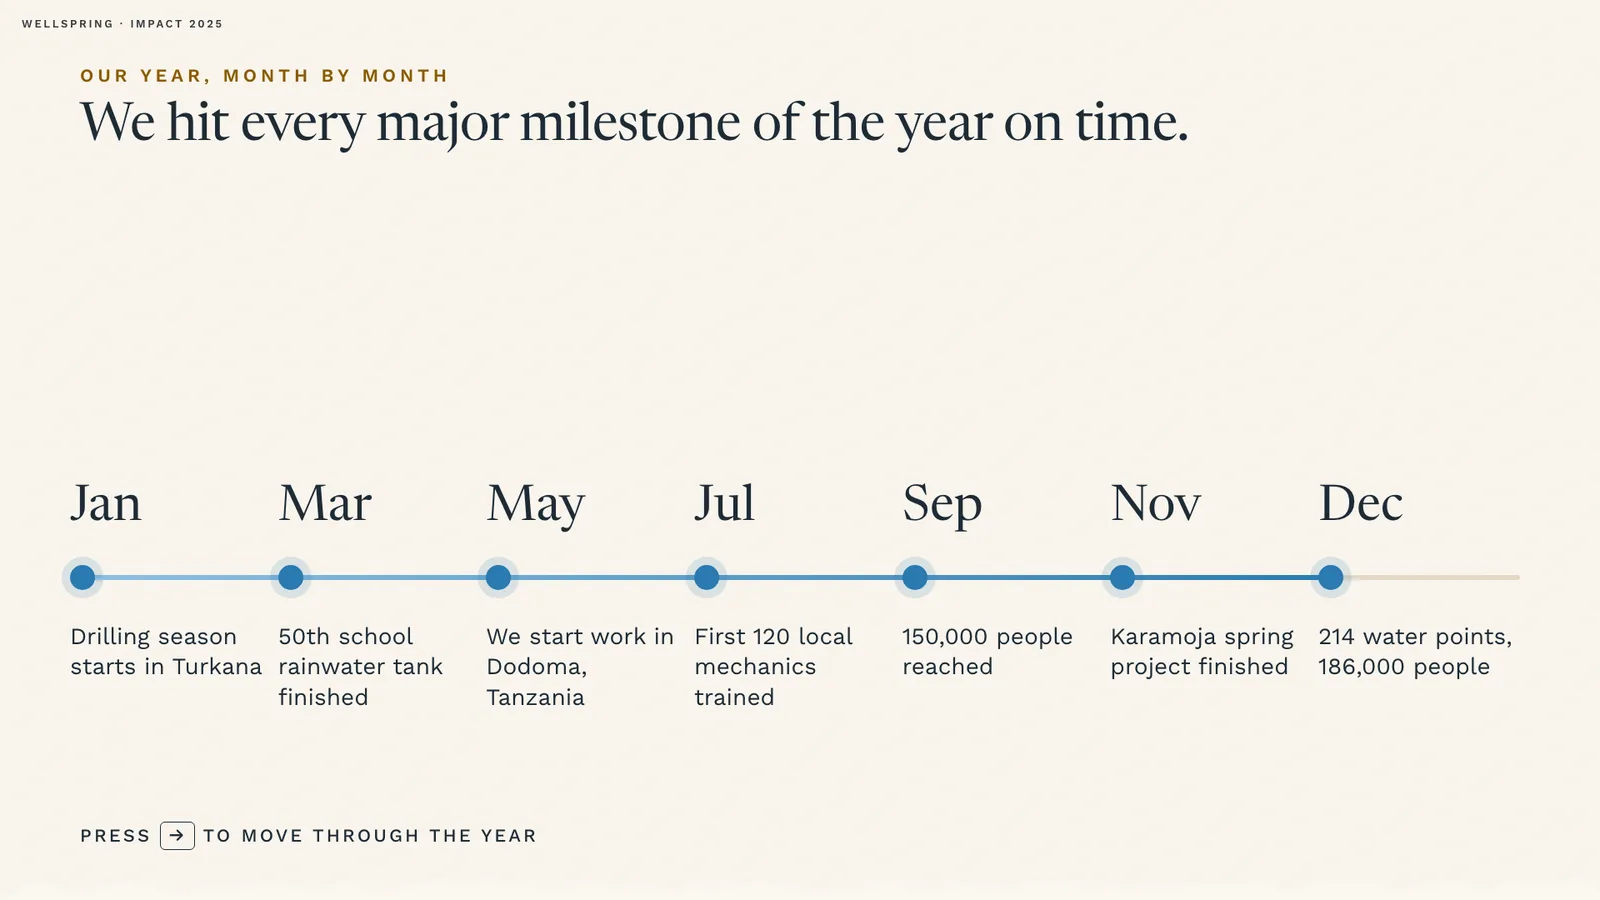
Wellspring slide 12: Month by month
12Month by monthStructure

05The money and the plan

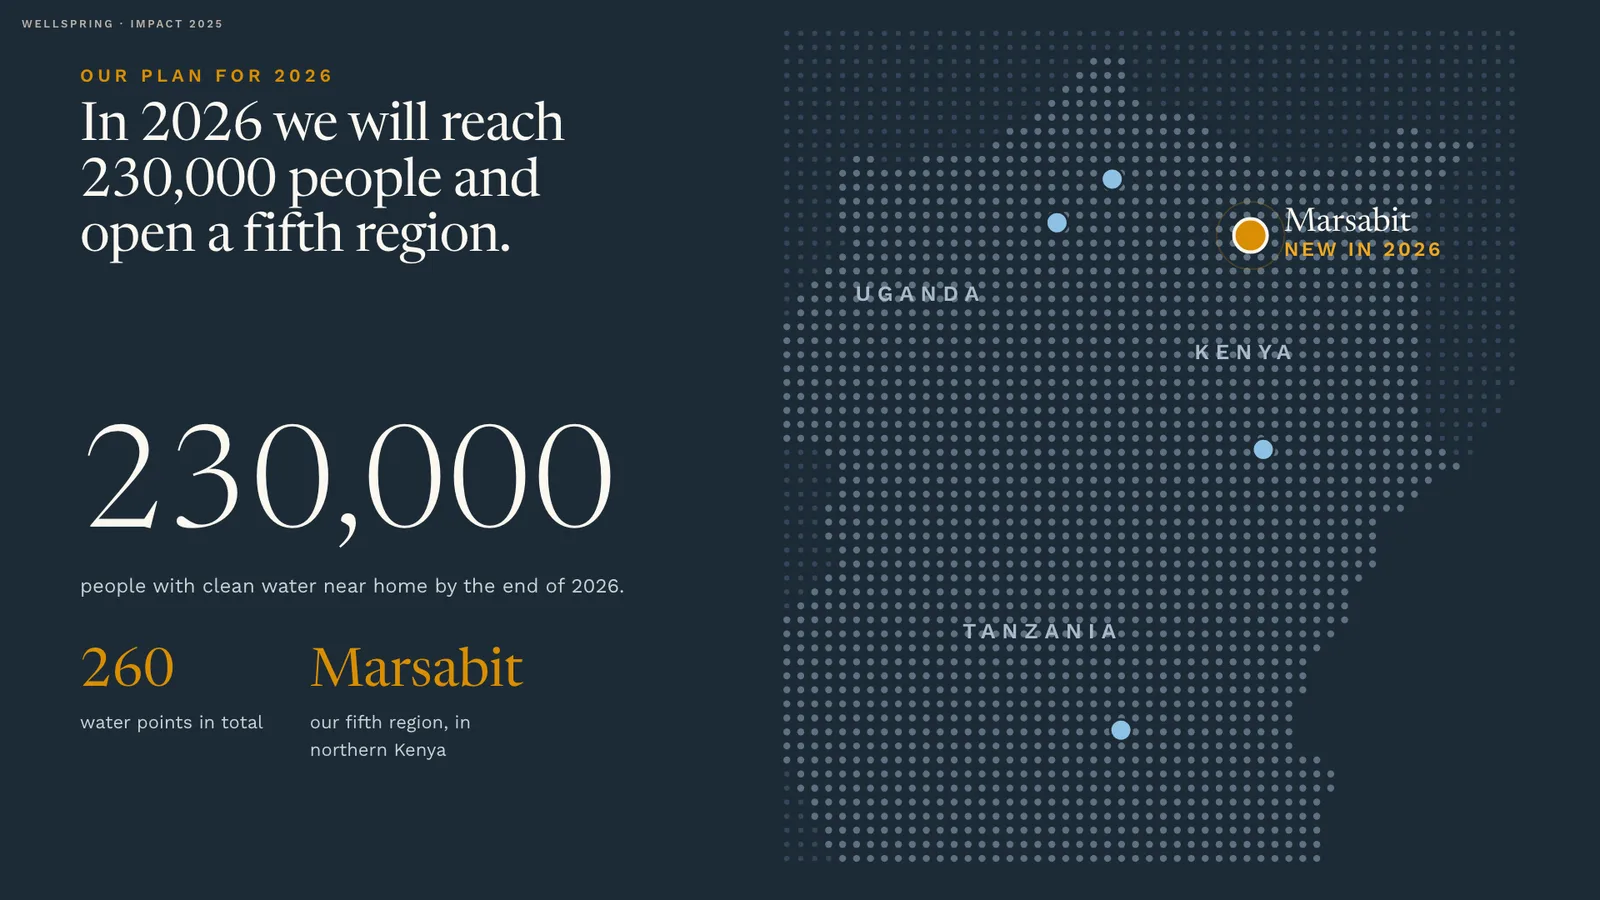
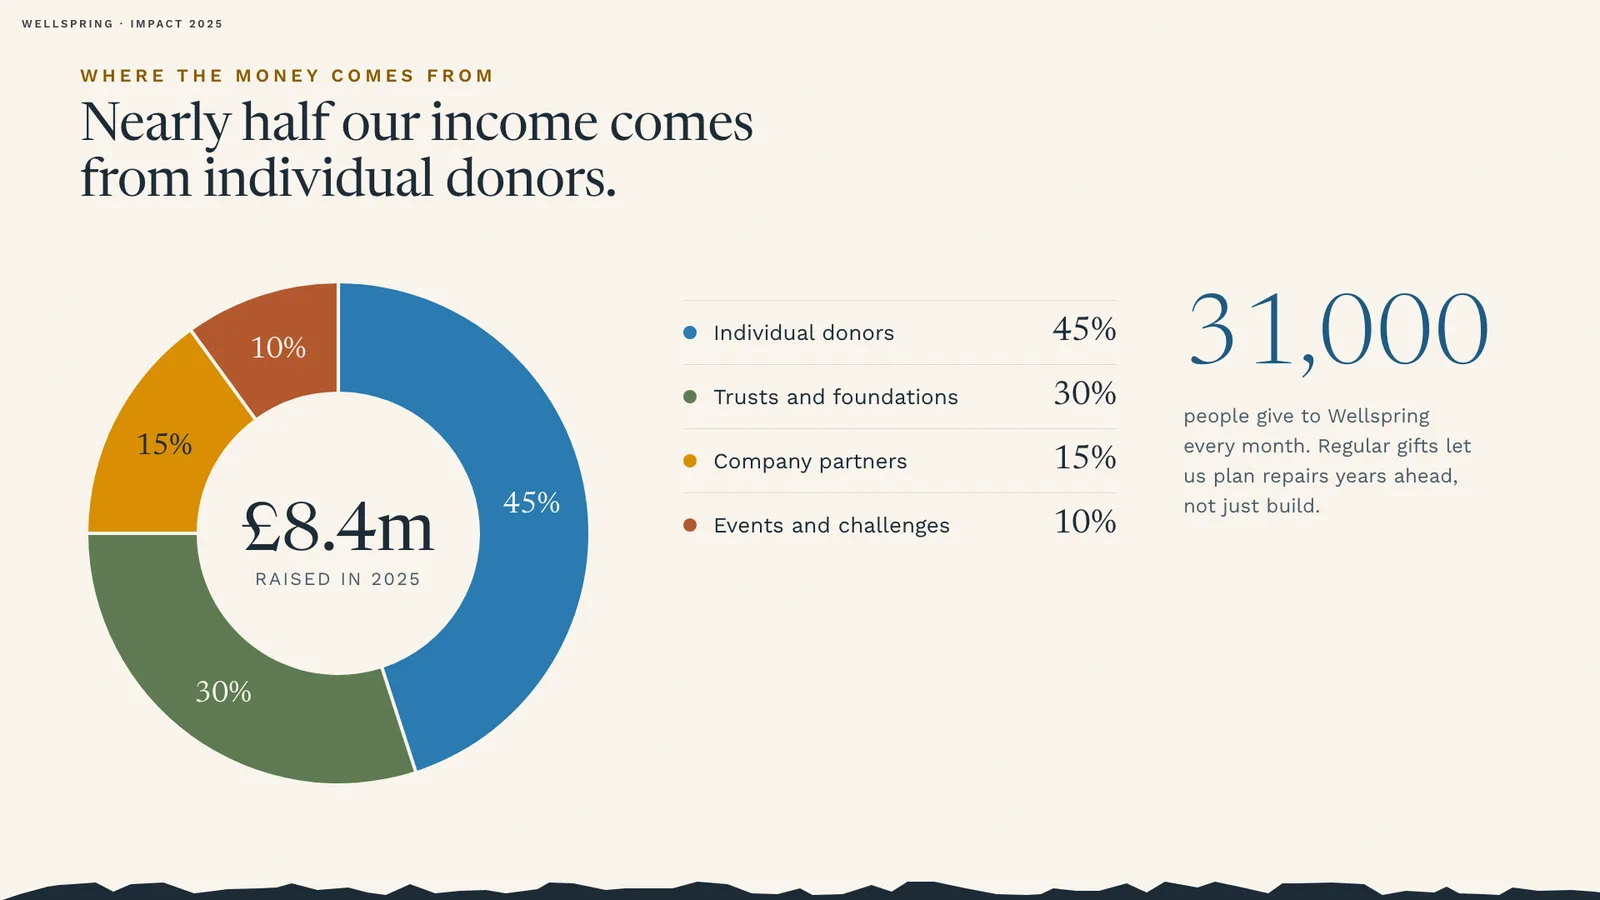
84p of every £1 goes to programmes. £8.4m from four kinds of giver. In 2026: 230,000 people and a fifth region, Marsabit.
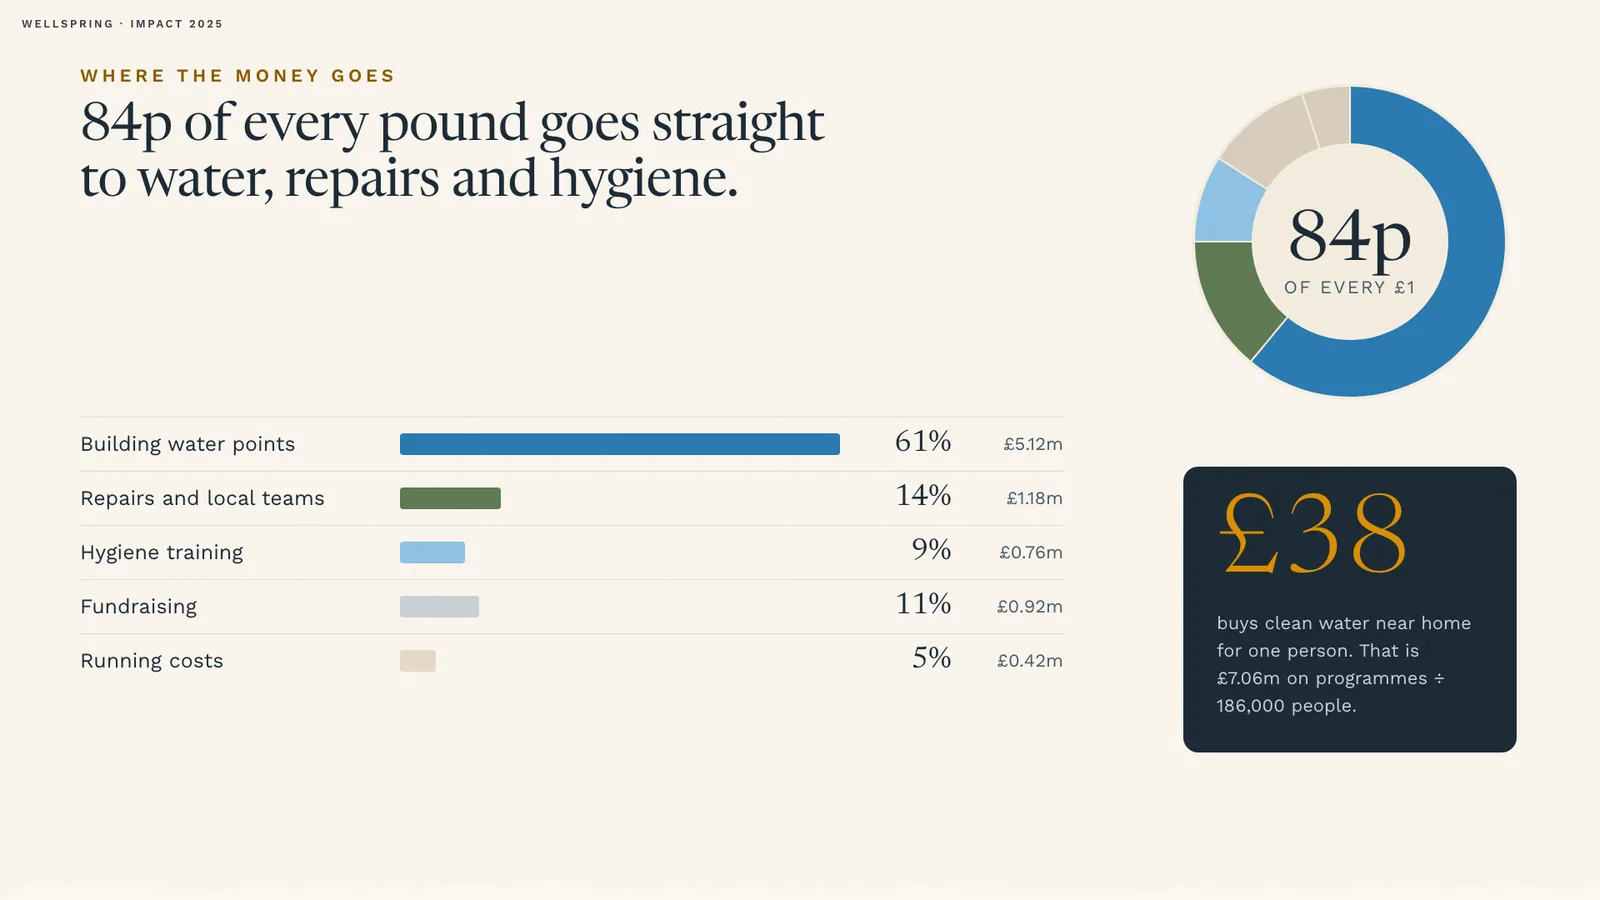
Wellspring slide 13: Where the money goes · 84p of every £1
13Where the money goes · 84p of every £1Data
Wellspring slide 14: Where the money comes from · £8.4m
14Where the money comes from · £8.4mData
Wellspring slide 15: Our plan for 2026 · 230,000 people
15Our plan for 2026 · 230,000 peopleStructure
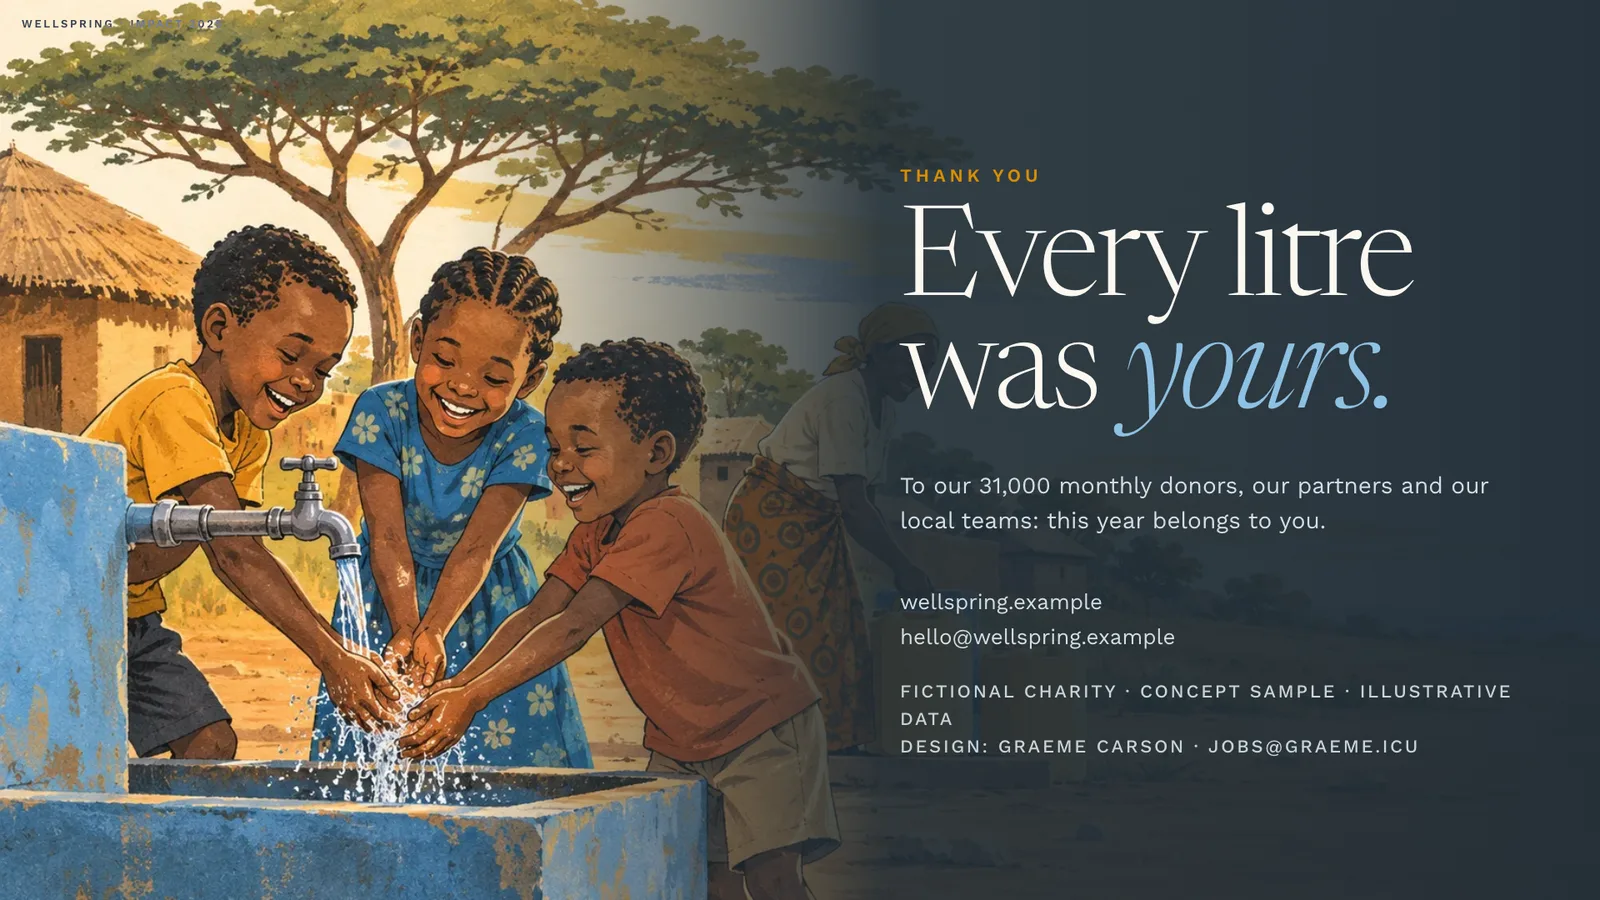
Wellspring slide 16: Thank you
16Thank youType
Next deck Student Leadership CouncilFour committee action plans. 27 tasks. One deck.
Start a project

Send me the material. I will find the story in it.

Notes, data, an old deck or a blank page. Tell me who will read it and what you need them to do.